Glazing
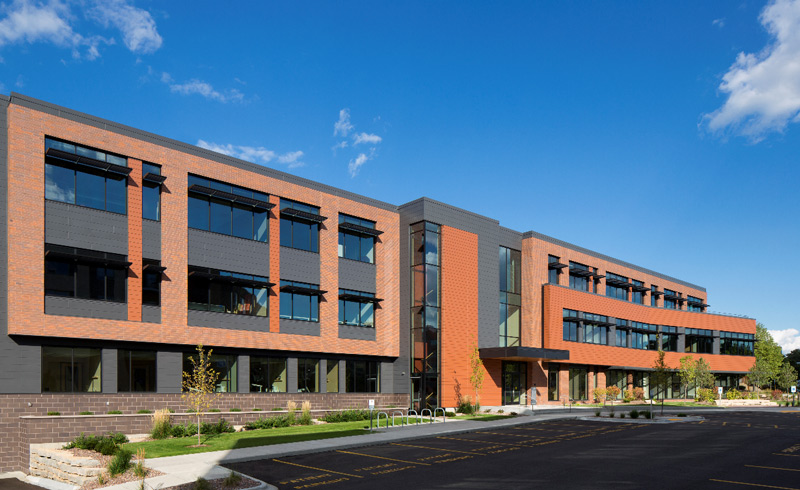
749 University Row has been optimized for window-to-wall ratio, daylighting, views and energy use. (Nels Akerlund Photography)
Traditional energy efficiency initiatives look at lighting and HVAC equipment in a building. Yet the sun or solar gain has a very large impact on energy use and comfort in a building. All buildings are affected by the sun, but glass buildings are the most affected. Buildings in the design phase have a unique opportunity to manage the amount of glass in the façades, use glass with good glazing properties, manage orientation, and keep people comfortable.
Learn more about a building located at 749 University Row that used modeling to optimize the window-to-wall ratio as well as determine the glazing properties. The window-to-wall ratio is about 35% for this well-designed building.
The down side to excessive glazing is higher capital costs for the building including HVAC equipment and the façade itself, higher operating costs due to air-conditioning needs, difficulty in providing uniform space temperatures and excessive glare. Computer screen glare impacts productivity. Adding interior blinds or sunscreens can minimize glare, but this also eliminates the views and does little to reduce the cooling load and comfort issues.
The primary driver for glass buildings is the look and status they convey. Influencing this design feature, if it is possible, needs to be done early by the key project decision makers and designers.
Designers rely on information to make knowledgeable decisions. However, glazing properties are not easy to find. The National Fenestration Rating Council (NFRC) provides a voluntary rating system for commercial glazing products, but there are no markings on commercial windows describing their performance. More product knowledge in this area would be better. (See below for definitions of glazing properties.)
The goal is not to prescribe that all buildings look the same but to increase awareness of glazing in designing high-performance, tenant-delighting, energy-efficient buildings. This results in architectural façades for mid- and high-rises that incorporate a mix of energy-efficient glazing and other surface materials that look good and work well together.
The following images illustrate the power of the sun and how glass is affected by incoming solar radiation.

This is a thermal image of a double-pane window in the sun on a March day. The inside temperature of the glass is about 93°F. Contrast this with the interior glass temperature of the second window (image below) that is in the shade. The sun has increased the interior window temperature by about 25˚F.
The emissivity of glass is typically listed between 0.92 and 0.94. The thermal imager emissivity was set to 0.95 or very close to the window's emissivity. This is the procedure to get the most accurate temperature readings from the thermal imager.

Same image in digital format. This image is based on a site visit of the WEA Member Benefits building on March 9, 2015, managed by the Oakbrook Corporation.

This is the same building on the same day but this window is in the shade. The interior window temperature is closer to outdoor air temperature and is about 69°F.
The performance criteria (U-value, SHGC, and VT) of both windows is unknown.

Same image in digital format. This image is based on a site visit of the WEA Member Benefits building on March 9, 2015, managed by the Oakbrook Corporation.

This thermal image shows how different nonglass materials are affected by solar energy. This is an uninsulated multi-layered brick wall (purplish in color ~ 73°F) with old windows being removed and infilled with concrete block (the yellow colored part ~ 82°F). The undulating pattern in the block shows the offset cores. It's also possible the cores are filled with insulation. The sun is shining on the wall during a summer day.

The same image in digital format. A close-up shows the blocks being staggered. This created the undulating pattern shown in the thermal image. Unidentified site.
Glazing is defined by four terms:
-
R-value is a common term and relates to resistance to heat flow through a building component. R-value is primarily concerned with temperature differences. Windows have typical R-values in the range of 1 to 3.5. (R-value is the common term and easier to understand, but U-value is used in rating systems, U = 1/R).
-
Solar Heat Gain Coefficient (SHGC) describes the ability of windows to block incident solar radiation on a scale of 0 to 1. A SHGC of 0.3, for example, blocks most of the sun's energy from moving into a building. In larger commercial buildings, this is beneficial as it minimizes the cooling load.
-
Visible Transmittance is a term that describes the ability of a glazing assembly to pass visible light. A higher value between 0 and 1 is better as more visible light enters the building for daylighting.
-
Emissivity is the measure of an object's ability to emit infrared energy. Emitted energy indicates the temperature of the object. Emissivity can have a value from 0 (shiny mirror) to 1.0 (blackbody). Most organic, painted, or oxidized surfaces have emissivity values close to 0.95.
Thank you to the companies that allowed us to use their images.
Oakbrook Corporation

Nels Akerlund Photography